moneyy99

Showing posts with label backtest report. Show all posts

Saturday, 18 July 2015

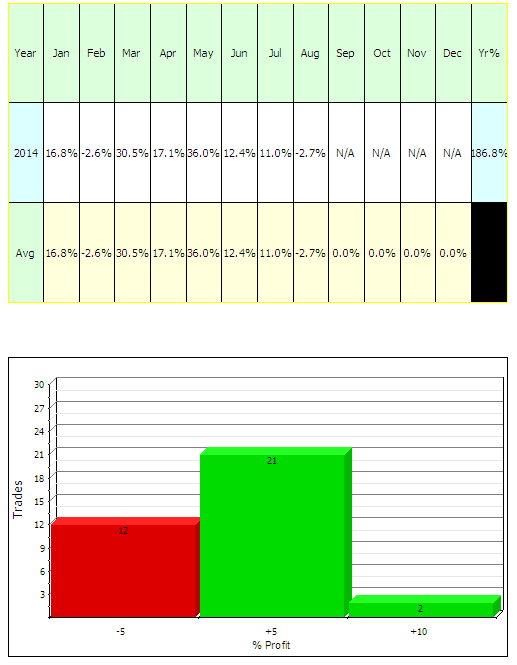
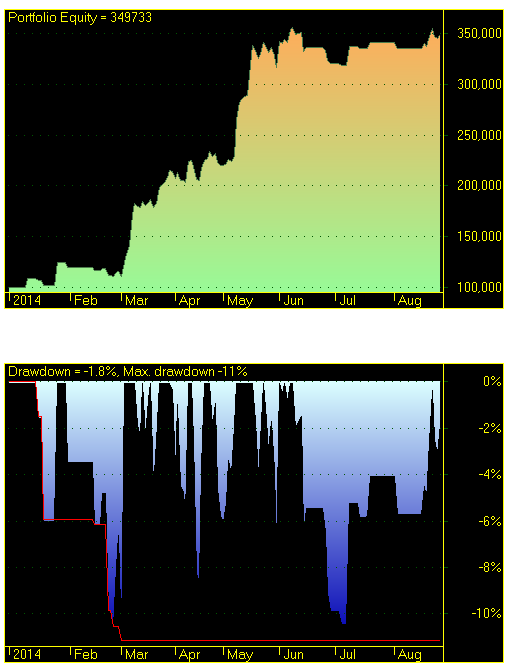
Crude oil back-test report of two years update for 18 July 2015


Sunday, 14 December 2014

Buy above and short below of Weekly performance for equity stocks on update 14 December 2014


TickerDate/TimeTradeBUY ABOVESHORT BELOWCMP
ABAN-EQ09/12/2014 9:59541.75526.35522.6
ABAN-EQ09/12/2014 10:59541.75526.35517
ABAN-EQ09/12/2014 11:59541.75526.35515.6
ABAN-EQ09/12/2014 12:59541.75526.35509.55
ABAN-EQ09/12/2014 13:59541.75526.35509.25
ABAN-EQ09/12/2014 14:59541.75526.35505.7
ABAN-EQ09/12/2014 15:59541.75526.35505.85
ABAN-EQ11/12/2014 15:54541.75471.2468.5
ABAN-EQ12/12/2014 10:59480471.2463.7
ABAN-EQ12/12/2014 11:59480471.2459.85
ABAN-EQ12/12/2014 12:59480471.2456.5
ABAN-EQ12/12/2014 13:59480471.2454
ABAN-EQ12/12/2014 14:59480471.2448.65

Wednesday, 1 October 2014

Nifty Future Backtest Results

The results from Oct 2005 to May 2012 :

  • Stock Name -                     Nifty Future
  • Time frame -                      30 Minute
  • Trade size -                       100 Share
  • Commission ;                     100 Rs. per trade
  • Average Annual Return:        63.30 % p.a.
  • Maximum Draw-down:          - 9.57 % p.a.
  • Win Percentage:                  46.46 % p.a.
  • Amount of Trades:                1795
  • Starting Captial :                  Rs. 1,00,000
  • Ending Capital:                     Rs. 25,28,680

Friday, 12 September 2014

Jobbing Trading System for amibroker

Jobbing Trading System Backtest Result


The results from January 1995 to August 2014 :
  • Stock Name -                     Nifty spot
  • Time frame -                       Daily
  • Trade size -                       100 Share
  • Commission ;                     100 Rs per trade
  • Average Annual Return:     16.50 % p.a.
  • Maximum Draw-down:     - 29 % p.a.
  • Win Percentage:                67.83 % p.a.
  • Amount of Trades:             115
  • Ending Capital:              Rs. 19,26,251


Sunday, 31 August 2014

ATR Volatility trading system for Amibroker

ATR VOLATILITY SYSTEM  

                                    is  Developed By :   Tudor Marcelin - Art Invest


today i have modified this system for daily base( time frame daily )  for index spot NSENIFTY. This system work on amibroker platform. I have modified and added new condition here and checkout its  backtest results since jan -2005 to aug -2014. Details are given below,


Download here :

//------------------------------------------------------------------------------
//
//  Formula Name:    ATR Volatility System
//  Author/Uploader: Marcelin 
//  E-mail:          marcelint@xnet.ro
//  Developed By :   Tudor Marcelin - Art Invest
//
//------------------------------------------------------------------------------
//
//  ATR trading system for short terms tradings. You can use it with Absolute
//  Strength Index for confirmation of signals.
//
//------------------------------------------------------------------------------

_SECTION_BEGIN("ATR Volatility Revised Edition");


GraphXSpace = 15;

SetChartOptions(0,chartShowArrows|chartShowDates);

SetChartBkColor(ParamColor("bkcolor",ColorRGB(0,0, 0)));

GfxSetBkMode(0); 

GfxSetOverlayMode(1);

SetBarFillColor(IIf(C>O,ParamColor("Candle UP Color", colorGreen),IIf(C<=O,ParamColor("Candle Down Color", colorRed),colorLightGrey)));

Plot(C,"\nPrice",IIf(C>O,ParamColor("Wick UP Color", colorDarkGreen),IIf(C<=O,ParamColor("Wick Down Color", colorDarkRed),colorLightGrey)),64,0,0,0,0);

R = RSI(9);
SK = StochK(10, 3);
SD = StochD(10, 3, 3);
MH = MACD(12, 26) - Signal(12, 26, 9);

//Conditions for Buying
//rB1=Param("RB1",50,1,100,1);

Cond1 = ValueWhen(C,O
Cond2 = R > 53;

Cond3 = SD < 100 AND SD > Ref(SD, -1);
Cond4 = MH > 0 OR (MH < 0 AND MH > Ref(MH, -1));

//Conditions for Selling

Cond5 = ValueWhen(C,O>C);

Cond6 = R < 40;

Cond7 = SD > 20 AND SD < Ref(SD, -1);
Cond8 = MH < 0 OR (MH > 0 AND MH < Ref(MH, -1));

Buy1 = Cover= Cond1 AND Cond2 AND Cond3 AND Cond4 ;
Sell1 = Short=  Cond5 AND Cond6 AND Cond7 AND Cond8 ;


   n=Param( "period", 15, 5 , 20, 1 );
   k=Param( "factor", 0.9, 0.5 , 2.5, 0.1 );

  f=ATR(n);
    
/*R Resistance */
    R[0] = C[0]; 
/*S Support  */ 
    S[0] = C[0];
  
for( i = n+1; i < BarCount; i++ ) 
{ 

    R[i]=R[i-1];
    S[i]=S[i-1];
    if (( S[i-1]<=C[i-1]) AND (C[i-1] <=R[i-1] ) AND (C[i-1]+k*f[i-1])<=RV)

        R[i] = C[i-1]+k*f[i-1];
   
     if (( S[i-1]<=C[i-1]) AND (C[i-1]<=R[i-1] ) AND  (C[i-1]-k*f[i-1])>=SV)

        S[i]= C[i-1]-k*f[i-1];


    if ( C[i-1] >R[i-1] )
{
       R[i] = C[i-1]+k*f[i-1];
       S[i]= C[i-1]-k*f[i-1];
       RV=R[i];
       SV=S[i]; 
}   
    if ( C[i-1]
{

       R[i] = C[i-1]+k*f[i-1];
       S[i]= C[i-1]-k*f[i-1];
       RV=R[i];
       SV=S[i]; 

} 


 Buy=Close>R AND Buy1;
 Sell=Close

Cump=IIf(Close>R,1,0);
Vanz=IIf(Close
}

Buy = ExRem( Buy, Sell ); 
Sell = ExRem( Sell, Buy );

iBuy = Flip( Buy, Sell ); 
iSell =Flip( Sell, Buy );


//Plot(IIf(iSell,R,Null), "Rez:",colorRed,styleDots|styleNoLine);
//Plot(IIf(iBuy,S,Null), "Sup:",colorGreen,styleDots|styleNoLine);

Short=Sell;

Cover=Buy;

Buy=ExRem(Buy,Sell); Sell=ExRem(Sell,Buy);  
Short=ExRem(Short,Cover); Cover=ExRem(Cover,Short);  
//SetOption("InitialEquity", 100000);
SetOption("AllowSameBarExit", False);
SetOption("AllowPositionShrinking", True);
SetOption("FuturesMode", True);
SetOption("InterestRate",0);
SetOption("MaxOpenPositions",1);
RoundLotSize= 2;
SetOption("MinShares",RoundLotSize);
SetOption("PriceBoundChecking",False);
//SetOption("CommissionMode",3);
//SetOption("CommissionAmount",12.5/RoundLotSize);
SetOption("AccountMargin",True);
SetOption("ReverseSignalForcesExit",False);
SetOption("UsePrevBarEquityForPosSizing",True);
SetOption("GenerateReport",1);
SetOption("MaxOpenLong",1);
SetOption("MaxOpenShort",1);
PositionSize = C*RoundLotSize*50.5;


SetOption("RefreshWhenCompleted",True);


//End of Settings for Backtester


BuyPrice=ValueWhen(Buy,C);

SellPrice=ValueWhen(Sell,C);

ShortPrice=ValueWhen(Short,C);

CoverPrice=ValueWhen(Cover,C);


Title = EncodeColor(colorWhite)+ "ATR Volatility System" +  Name() + " - " + EncodeColor(colorRed)+ Interval(2) + EncodeColor(colorWhite) +

 "  - " + Date() +" - "+"\n" +EncodeColor(colorRed) +"Op-"+O+"  "+"Hi-"+H+"  "+"Lo-"+L+"  "+

"Cl-"+C+"  "+ "Vol= "+ WriteVal(V)+"\n"+ 

EncodeColor(colorLime)+

WriteIf (Buy , " GO LONG / Reverse Signal at "+C+"  ","")+

WriteIf (Sell , " EXIT LONG / Reverse Signal at "+C+"  ","")+"\n"+EncodeColor(colorYellow)+

WriteIf(Sell , "Total Profit/Loss for the Last Trade Rs."+(C-BuyPrice)+"","")+

WriteIf(Buy  , "Total Profit/Loss for the Last trade Rs."+(SellPrice-C)+"","");


PlotShapes(IIf(Buy, shapeSquare, shapeNone),colorGreen, 0, L, Offset=-40);

PlotShapes(IIf(Buy, shapeSquare, shapeNone),colorLime, 0,L, Offset=-50);                      

PlotShapes(IIf(Buy, shapeUpArrow, shapeNone),colorWhite, 0,L, Offset=-45); 

PlotShapes(IIf(Short, shapeSquare, shapeNone),colorRed, 0, H, Offset=40);

PlotShapes(IIf(Short, shapeSquare, shapeNone),colorOrange, 0,H, Offset=50);                      

PlotShapes(IIf(Short, shapeDownArrow, shapeNone),colorWhite, 0,H, Offset=-45);

//Magfied Market Price

FS=Param("Font Size",30,11,100,1);

GfxSelectFont("Times New Roman", FS, 700, True ); 

GfxSetBkMode( colorWhite );  

GfxSetTextColor( ParamColor("Color",colorGreen) ); 

Hor=Param("Horizontal Position",940,1,1200,1);

Ver=Param("Vertical Position",12,1,830,1); 

GfxTextOut(""+C, Hor , Ver );

YC=TimeFrameGetPrice("C",inDaily,-1);

DD=Prec(C-YC,2);

xx=Prec((DD/YC)*100,2);

GfxSelectFont("Times New Roman", 11, 700, True ); 

GfxSetBkMode( colorBlack );  

GfxSetTextColor(ParamColor("Color",colorYellow) ); 

GfxTextOut(""+DD+"  ("+xx+"%)", Hor , Ver+45 );


_SECTION_END();

© Copyright 2015 Moneyy99. Designed by Parag Patil