
NSENIFTY closed up 6.700 at 8,121.450. Volume was 3% above average (neutral) and Bollinger Bands were 33% narrower than normal.
Open High Low Close Volume___
8,129.400 8,160.900 8,105.350 8,121.450 161,284,512

NSENIFTY is currently 16.6% above its 200-period moving average and is in an upward trend. Volatility is extremely high when compared to the average volatility over the last 10 periods. There is a good possibility that volatility will decrease and prices will stabilize in the near term. Our volume indicators reflect volume flowing into and out of NSENIFTY at a relatively equal pace (neutral). Our trend forecasting oscillators are currently bullish on NSENIFTY and have had this outlook for the last 26 periods.

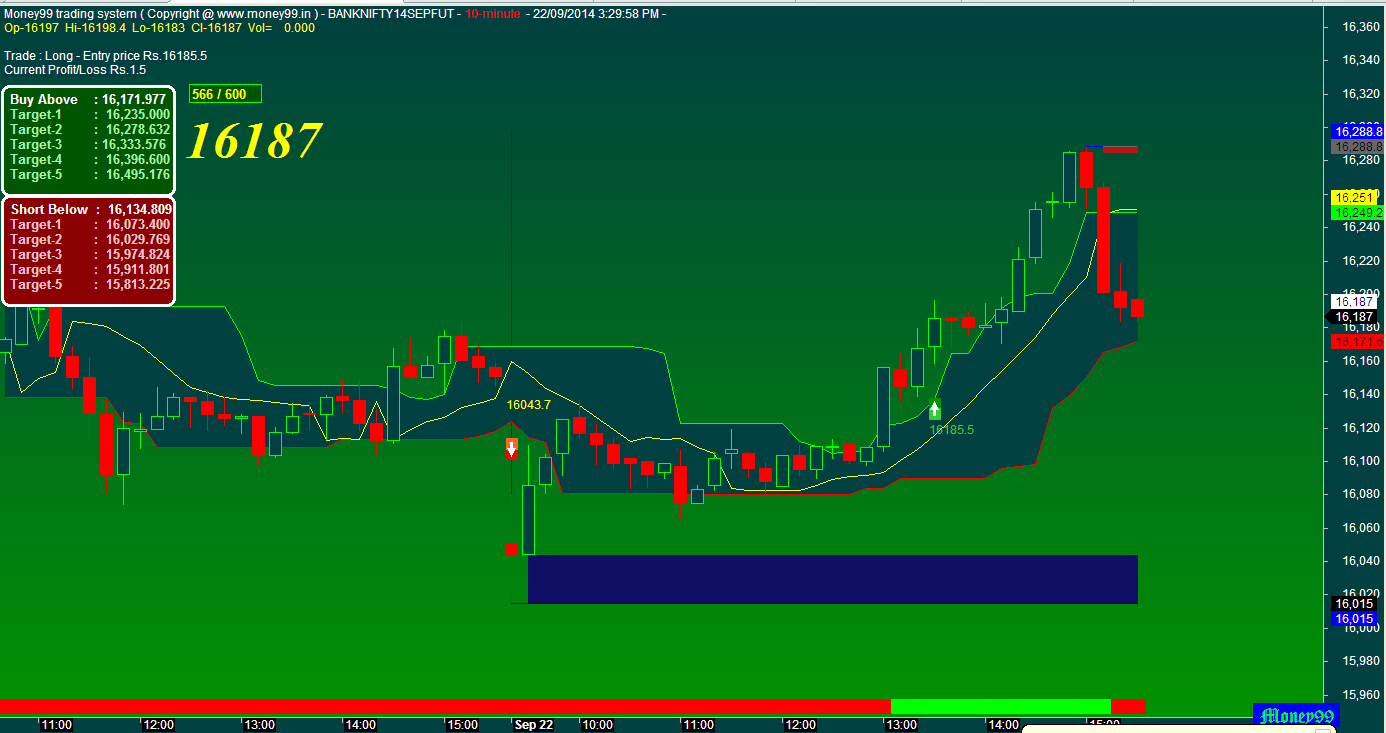
BANKNIFTY closed up 42.399 at 16,194.550. Volume was 37% below average (neutral) and Bollinger Bands were 45% narrower than normal.
Open High Low Close Volume___
16,052.550 16,272.350 16,021.150 16,194.550 19,099,454
BANKNIFTY is currently 21.6% above its 200-period moving average and is in an upward trend. Volatility is relatively normal as compared to the average volatility over the last 10 periods. Our volume indicators reflect volume flowing into and out of BANKNIFTY at a relatively equal pace (neutral). Our trend forecasting oscillators are currently bullish on BANKNIFTY and have had this outlook for the last 22 periods.
GOLDBEES closed down -10.900 at 2,468.950. Volume was 15% below average (neutral) and Bollinger Bands were 26% narrower than normal.
Open High Low Close Volume___
2,474.000 2,474.000 2,462.500 2,468.950 20,843
GOLDBEES is currently 7.9% below its 200-period moving average and is in an downward trend. Volatility is extremely low when compared to the average volatility over the last 10 periods. There is a good possibility that there will be an increase in volatility along with sharp price fluctuations in the near future. Our volume indicators reflect moderate flows of volume out of GOLDBEES (mildly bearish). Our trend forecasting oscillators are currently bearish on GOLDBEES and have had this outlook for the last 20 periods. Our momentum oscillator is currently indicating that GOLDBEES is currently in an oversold condition.
MCX closed down -7.600 at 825.100. Volume was 77% below average (consolidating) and Bollinger Bands were 55% narrower than normal.
Open High Low Close Volume___
824.700 843.000 818.050 825.100 331,845
MCX is currently 37.5% above its 200-period moving average and is in an upward trend. Volatility is relatively normal as compared to the average volatility over the last 10 periods. Our volume indicators reflect volume flowing into and out of MCX at a relatively equal pace (neutral). Our trend forecasting oscillators are currently bullish on MCX and have had this outlook for the last 0 periods.
Open High Low Close Volume___
8,129.400 8,160.900 8,105.350 8,121.450 161,284,512
- Technical Outlook
- Short Term: Neutral
- Intermediate Term: Bullish
- Long Term: Bullish
- Moving Averages: 10-period 50-period 200-period
- Close: 8,079.88 7,836.38 6,966.64
- Volatility: 17 14 15
- Volume: 108,608,976 131,603,952 158,035,344
NSENIFTY is currently 16.6% above its 200-period moving average and is in an upward trend. Volatility is extremely high when compared to the average volatility over the last 10 periods. There is a good possibility that volatility will decrease and prices will stabilize in the near term. Our volume indicators reflect volume flowing into and out of NSENIFTY at a relatively equal pace (neutral). Our trend forecasting oscillators are currently bullish on NSENIFTY and have had this outlook for the last 26 periods.
Sector Perforance
BANKNIFTY closed up 42.399 at 16,194.550. Volume was 37% below average (neutral) and Bollinger Bands were 45% narrower than normal.
Open High Low Close Volume___
16,052.550 16,272.350 16,021.150 16,194.550 19,099,454
- Technical Outlook
- Short Term: Neutral
- Intermediate Term: Bullish
- Long Term: Bullish
- Moving Averages: 10-period 50-period 200-period
- Close: 16,112.06 15,524.87 13,321.10
- Volatility: 18 21 27
- Volume: 23,320,186 25,566,136 31,068,252
BANKNIFTY is currently 21.6% above its 200-period moving average and is in an upward trend. Volatility is relatively normal as compared to the average volatility over the last 10 periods. Our volume indicators reflect volume flowing into and out of BANKNIFTY at a relatively equal pace (neutral). Our trend forecasting oscillators are currently bullish on BANKNIFTY and have had this outlook for the last 22 periods.
GOLDBEES closed down -10.900 at 2,468.950. Volume was 15% below average (neutral) and Bollinger Bands were 26% narrower than normal.
Open High Low Close Volume___
2,474.000 2,474.000 2,462.500 2,468.950 20,843
- Technical Outlook
- Short Term: Neutral
- Intermediate Term: Bearish
- Long Term: Bearish
- Moving Averages: 10-period 50-period 200-period
- Close: 2,496.63 2,566.96 2,681.83
- Volatility: 7 12 12
- Volume: 20,490 17,208 25,547
GOLDBEES is currently 7.9% below its 200-period moving average and is in an downward trend. Volatility is extremely low when compared to the average volatility over the last 10 periods. There is a good possibility that there will be an increase in volatility along with sharp price fluctuations in the near future. Our volume indicators reflect moderate flows of volume out of GOLDBEES (mildly bearish). Our trend forecasting oscillators are currently bearish on GOLDBEES and have had this outlook for the last 20 periods. Our momentum oscillator is currently indicating that GOLDBEES is currently in an oversold condition.
MCX closed down -7.600 at 825.100. Volume was 77% below average (consolidating) and Bollinger Bands were 55% narrower than normal.
Open High Low Close Volume___
824.700 843.000 818.050 825.100 331,845
- Technical Outlook
- Short Term: Neutral
- Intermediate Term: Bullish
- Long Term: Bullish
- Moving Averages: 10-period 50-period 200-period
- Close: 820.89 813.33 600.12
- Volatility: 28 55 68
- Volume: 528,465 1,337,972 1,591,449
MCX is currently 37.5% above its 200-period moving average and is in an upward trend. Volatility is relatively normal as compared to the average volatility over the last 10 periods. Our volume indicators reflect volume flowing into and out of MCX at a relatively equal pace (neutral). Our trend forecasting oscillators are currently bullish on MCX and have had this outlook for the last 0 periods.
About Money99
Parag Patil is a technical analyst and trading system designer with stock excel programmer. I hope the articles and live chart of nse future and mcx on this Website will be as helpful and profitable to you . I try to update and post new articles tips everyday. My motto is to encourage the traders, so that they should able to understand the technique views behind the moment of stocks. I have deeply analyzed with many technical indicator with parameter and added to my amibroker afl. And even taken backtest report which is never being implemented. Any of the analyst expect me. Seeing all this you may understand that my views is more technical than commercial. If you are profited by my views I fill happy.

0 comentários:
Post a Comment