
The Indian markets witnessed a huge sell-off as Sensex fell over 500 points amid concerns over participatory notes norms and over Chinese stock markets plunging over 8%. While the BSE-Sensex fell 550 points, NSE-Nifty was down 160 points. Both the S&P BSE Midcap and S&P BSE Smallcap were not spared either and were down 1.4% and 1% respectively. Sectors that lost the most included capital goods, metal and power.
NSENIFTY closed down -160.550 at 8,361.000. Volume was 5% below average (neutral) and Bollinger Bands were 35% narrower than normal.

- Open High Low Close Volume___
- 8,492.100 8,492.200 8,351.550 8,361.000 140,828,064
- Technical Outlook
- Short Term: Neutral
- Intermediate Term: Bullish
- Long Term: Bearish
- Moving Averages: 10-period 50-period 200-period
- Close: 8,543.46 8,342.62 8,408.50
- Volatility: 17 17 18
- Volume: 125,430,096 146,707,632 153,694,896
NSENIFTY gapped down today (bearish) on normal volume. Possibility of a Runaway Gap which usually signifies a continuation of the trend. Four types of price gaps exist - Common, Breakaway, Runaway, and Exhaustion. Gaps acts as support/resistance.
NSENIFTY is currently 0.6% below its 200-period moving average and is in an upward trend. Volatility is extremely high when compared to the average volatility over the last 10 periods. There is a good possibility that volatility will decrease and prices will stabilize in the near term. Our volume indicators reflect moderate flows of volume into NSENIFTY (mildly bullish). Our trend forecasting oscillators are currently bullish on NSENIFTY and have had this outlook for the last 24 periods. our momentum oscillator has set a new 14-period low while the security price has not. This is a bearish divergence.
Among other Asian markets, Shanghai Composite index plunged almost 8.48%, Japan's Nikkei fell 0.9% and Hong Kong's Hang Seng was down 3.11%. European equities started the week on a downbeat note, heading for their fifth straight daily fall. The rupee was trading at 64.00 against the US$ in late afternoon trade.
BANKNIFTY closed down -422.799 at 18,213.051. Volume was 10% below average (neutral) and Bollinger Bands were 34% narrower than normal.
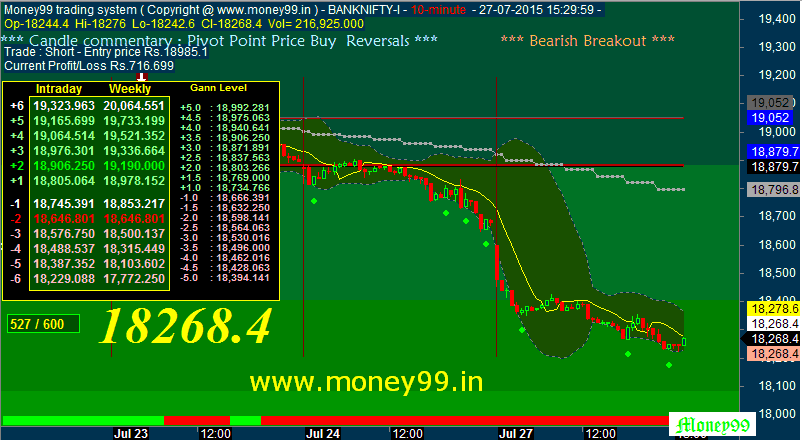
- Open High Low Close Volume___
- 18,566.55118,566.55118,187.44918,213.051 48,338,056
- Technical Outlook
- Short Term: Oversold
- Intermediate Term: Bullish
- Long Term: Bearish
- Moving Averages: 10-period 50-period 200-period
- Close: 18,832.62 18,329.44 18,276.62
- Volatility: 23 22 26
- Volume: 47,091,832 54,046,604 50,016,356
BANKNIFTY gapped down today (bearish) on normal volume. Possibility of a Runaway Gap which usually signifies a continuation of the trend. Four types of price gaps exist - Common, Breakaway, Runaway, and Exhaustion. Gaps acts as support/resistance.
BANKNIFTY is currently 0.3% below its 200-period moving average and is in an upward trend. Volatility is extremely high when compared to the average volatility over the last 10 periods. There is a good possibility that volatility will decrease and prices will stabilize in the near term. Our volume indicators reflect volume flowing into and out of BANKNIFTY at a relatively equal pace (neutral). Our trend forecasting oscillators are currently bullish on BANKNIFTY and have had this outlook for the last 23 periods.
About Money99
Parag Patil is a technical analyst and trading system designer with stock excel programmer. I hope the articles and live chart of nse future and mcx on this Website will be as helpful and profitable to you . I try to update and post new articles tips everyday. My motto is to encourage the traders, so that they should able to understand the technique views behind the moment of stocks. I have deeply analyzed with many technical indicator with parameter and added to my amibroker afl. And even taken backtest report which is never being implemented. Any of the analyst expect me. Seeing all this you may understand that my views is more technical than commercial. If you are profited by my views I fill happy.

0 comentários:
Post a Comment