
The Indian equity markets gathered steam and closed the day in the green. While the BSE Sensex today closed higher by 165 points, the NSE-Nifty closed higher by 53 points. In this process the Sensex scaled 28,500 mark today. However, Midcaps and Smallcaps closed weak. While the BSE Mid Cap index was up by 0.07% the BSE Small Cap index closed lower by 0.06%. IT and metal stocks were the biggest gainers today.


NSENIFTY closed up 52 point at 8,530.150. Volume was 2% above average (neutral) and Bollinger Bands were 35% wider than normal.
- Open High Low Close Volume___
- 8,490.950 8,534.650 8,490.800 8,530.150 140,657,504
- Technical Outlook
- Short Term: Overbought
- Intermediate Term: Bullish
- Long Term: Bullish
- Moving Averages: 10-period 50-period 200-period
- Close: 8,414.21 8,109.96 7,331.30
- Volatility: 8 15 15
- Volume: 129,578,992 136,759,024 155,558,624
NSENIFTY gapped up today (bullish) on normal volume. Possibility of a Runaway Gap which usually signifies a continuation of the trend. Four types of price gaps exist - Common, Breakaway, Runaway, and Exhaustion. Gaps acts as support/resistance.
NSENIFTY is currently 16.4% above its 200-period moving average and is in an upward trend. Volatility is extremely low when compared to the average volatility over the last 10 periods. There is a good possibility that there will be an increase in volatility along with sharp price fluctuations in the near future. Our volume indicators reflect moderate flows of volume into NSENIFTY (mildly bullish). Our trend forecasting oscillators are currently bullish on NSENIFTY and have had this outlook for the last 15 periods. Our momentum oscillator is currently indicating that NSENIFTY is currently in an overbought condition.
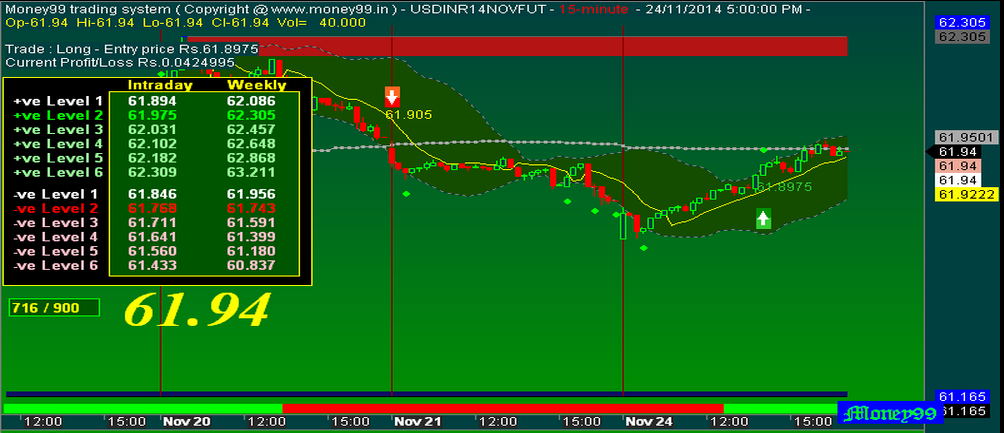
the Asian pack closed strong today. The rupee was trading at Rs 61.92 to the dollar at the time of writing.
BANKNIFTY closed up 225.648 at 18,281.949. Volume was 54% above average (neutral) and Bollinger Bands were 38% wider than normal.
- Open High Low Close Volume___
- 18,128.600 18,313.100 18,119.650 18,281.949 40,439,296
- Technical Outlook
- Short Term: Overbought
- Intermediate Term: Bullish
- Long Term: Bullish
- Moving Averages: 10-period 50-period 200-period
- Close: 17,691.89 16,437.96 14,320.44
- Volatility: 16 22 26
- Volume: 30,603,104 26,198,170 30,821,420
BANKNIFTY is currently 27.7% above its 200-period moving average and is in an upward trend. Volatility is extremely low when compared to the average volatility over the last 10 periods. There is a good possibility that there will be an increase in volatility along with sharp price fluctuations in the near future. Our volume indicators reflect moderate flows of volume into BANKNIFTY (mildly bullish). Our trend forecasting oscillators are currently bullish on BANKNIFTY and have had this outlook for the last 20 periods. Our momentum oscillator is currently indicating that BANKNIFTY is currently in an overbought condition.
MCX closed down -10.100 at 880.050. Volume was 44% below average (neutral) and Bollinger Bands were 30% narrower than normal.
Open High Low Close Volume___
899.300 900.000 866.100 880.050 588,705
Technical Outlook
Short Term: Neutral
Intermediate Term: Bullish
Long Term: Bullish
Moving Averages: 10-period 50-period 200-period
Close: 863.09 817.51 663.48
Volatility: 34 36 57
Volume: 583,178 516,936 1,266,666
MCX is currently 32.6% above its 200-period moving average and is in an upward trend. Volatility is low as compared to the average volatility over the last 10 periods. Our volume indicators reflect moderate flows of volume into MCX (mildly bullish). Our trend forecasting oscillators are currently bullish on MCX and have had this outlook for the last 16 periods.
GOLDBEES closed up 3.950 at 2,435.150. Volume was 17% above average (neutral) and Bollinger Bands were 36% wider than normal.
Open High Low Close Volume___
2,440.0002,441.0002,423.2502,435.150 24,717
Technical Outlook
Short Term: Neutral
Intermediate Term: Bearish
Long Term: Bearish
Moving Averages: 10-period 50-period 200-period
Close: 2,418.46 2,472.59 2,621.66
Volatility: 14 14 14
Volume: 23,423 25,091 25,657
GOLDBEES is currently 7.1% below its 200-period moving average and is in an downward trend. Volatility is extremely low when compared to the average volatility over the last 10 periods. There is a good possibility that there will be an increase in volatility along with sharp price fluctuations in the near future. Our volume indicators reflect moderate flows of volume out of GOLDBEES (mildly bearish). Our trend forecasting oscillators are currently bearish on GOLDBEES and have had this outlook for the last 13 periods.
About Money99
Parag Patil is a technical analyst and trading system designer with stock excel programmer. I hope the articles and live chart of nse future and mcx on this Website will be as helpful and profitable to you . I try to update and post new articles tips everyday. My motto is to encourage the traders, so that they should able to understand the technique views behind the moment of stocks. I have deeply analyzed with many technical indicator with parameter and added to my amibroker afl. And even taken backtest report which is never being implemented. Any of the analyst expect me. Seeing all this you may understand that my views is more technical than commercial. If you are profited by my views I fill happy.

0 comentários:
Post a Comment